
On time delivery, measured as OTD or its stricter cousin OTIF, tells you whether orders arrive when you promised a customer they would. A healthy result sits between roughly 85% and 98% depending on your sector, with world-class operations clearing 95% or higher.
TL;DR:
- OTIF scores are generally 88% to 92% in most sectors, with top performers reaching above 95%, depending on industry and delivery window strictness.
- Defining the on-time date is critical, with most teams choosing the customer’s requested date to reflect real customer expectations and ensure consistency.
- Measurement levels (order, line, or case) significantly impact reported scores, with case-level typically producing higher percentages than order-level metrics.
- Causes of late or incomplete deliveries include forecast errors, carrier delays, inventory issues, and order processing delays, which can be diagnosed using leading indicators.
- Implementing real-time analytics, better inventory management, and supplier collaboration can help improve OTIF and OTD performance over time.
Table of Contents
- Defining OTD vs OTIF and setting your on-time window
- Metrics and formulas: how to calculate OTD and OTIF
- Worked examples: OTD and OTIF calculations you can replicate
- Benchmarks and targets by sector
- Root causes and diagnostics across the order-to-delivery cycle
- A prioritized playbook for improving delivery performance
- Tools and technology that move the needle on OTD
- How Or-ner approaches OTD measurement and support
- What logistics managers should prioritize first
- Get your on-time delivery assessment started
- FAQ
- Sources
Defining OTD vs OTIF and setting your on-time window
On-time delivery (OTD) counts whether an order arrived by the date you committed to. On time, in full (OTIF) adds a second condition: the order also has to arrive complete, with the full quantity and the right items. APQC defines OTIF as the percentage of orders delivered complete and on time, and most retailers and manufacturers now treat OTIF as the metric that actually reflects customer experience, since a shipment that arrives on schedule but short of quantity still creates a problem downstream.
The harder question is which date counts as “on time.” Some teams measure against the date the customer requested, others against an appointment slot a warehouse confirmed, and others against an internally committed ship date. McKinsey’s research on defining on-time, in-full found no universal standard, and many practitioners prefer the requested delivery date as the cleanest reference point because it reflects what the customer actually expected. Whatever you choose, write it down and get sales, operations, and finance to agree on it before you start reporting a number, because mismatched definitions make your OTD trend meaningless.
Metrics and formulas: how to calculate OTD and OTIF
The standard OTD formula is simple: divide the number of orders delivered on or before the committed date by the total number of orders shipped, then multiply by 100. MetricHQ documents this formula along with worked examples you can adapt directly to your own order data.
OTIF uses the same denominator but tightens the numerator: an order only counts as a success if it is both on time and complete. A shipment that arrives a day early but missing two line items fails OTIF, and so does a shipment that arrives full but a day late.
Where you draw the measurement boundary changes your reported number. Order-level measurement treats the whole order as a single pass or fail. Line-level measurement checks each product line separately, which tends to produce a lower, more honest score because one missing SKU on an otherwise perfect order still counts as a miss. Case-level measurement goes further, tracking individual cartons, which matters most for large or split shipments. Our on-time delivery metrics guide walks through SQL queries for calculating these variations consistently across a dataset, which matters once you are pulling from multiple warehouse or carrier systems.
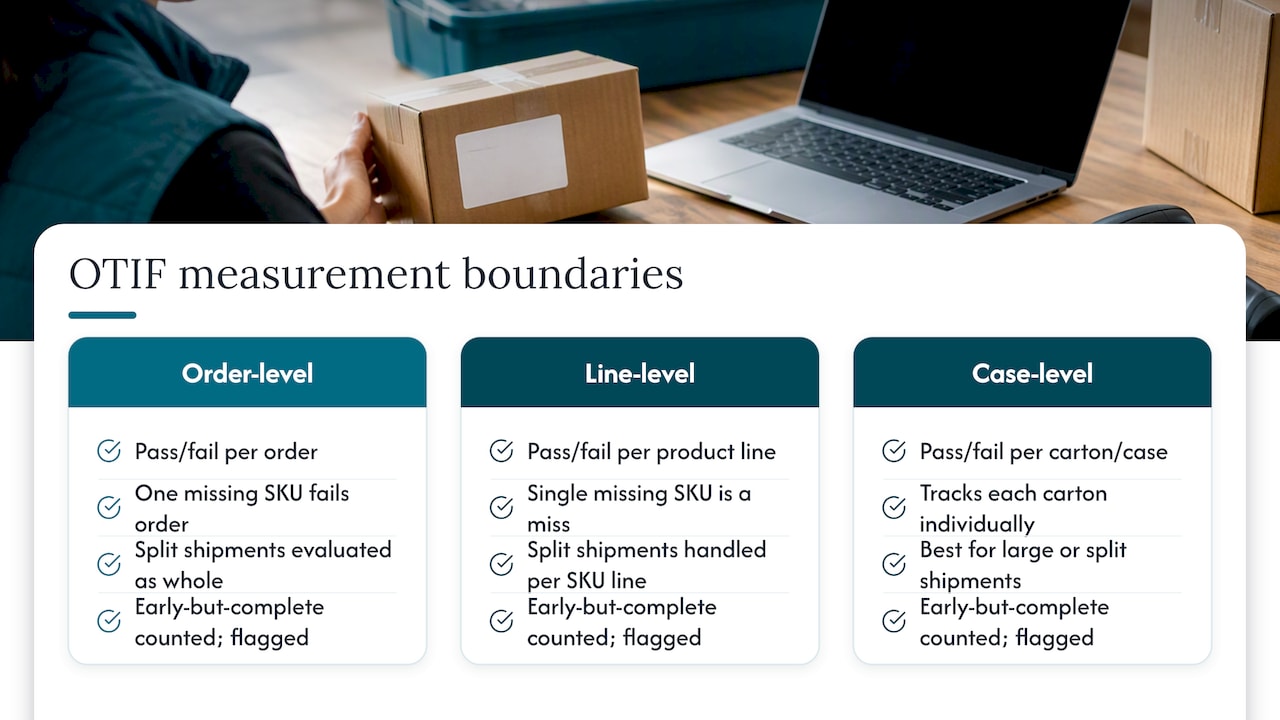
Early deliveries, partial shipments, and exceptions (weather holds, customer refusals, address errors) need a documented rule too. Most teams count early-but-complete as on time for OTD but flag it separately, since arriving too early can cause its own problems at a receiving dock.
Worked examples: OTD and OTIF calculations you can replicate
A few numbers make the formulas concrete.
- Simple OTD month: You shipped 500 orders in a month and 460 arrived by the committed date. OTD equals 460 divided by 500, times 100, which gives you 92%.
- OTIF with a short shipment: Of those same 500 orders, 460 were on time, but 20 of those “on time” orders were missing items. OTIF counts only orders that are both on time and complete, so you subtract the 20 short orders from the 460, leaving 440. OTIF equals 440 divided by 500, or 88%, four points below OTD on the exact same shipments.
- Case-level versus order-level: Say one order contains 10 cases and 1 arrives damaged. At order level, that whole order fails, a binary miss. At case level, you record 9 of 10 cases as successful, a 90% result for that single order. Aggregated across hundreds of orders, case-level scoring almost always produces a higher reported percentage than order-level scoring, which is why you should never compare OTD numbers across companies or even across your own facilities without confirming which method each one uses.
Our guide to measuring delivery performance covers how to decide which measurement level fits your order profile, particularly for ecommerce sellers shipping multi-item orders.
Benchmarks and targets by sector
Acceptable OTIF varies by industry, customer base, and how unforgiving your delivery window is. Supply Chain Desk’s benchmarking puts typical ranges at:
- Consumer packaged goods: 85% to 92%, with large retailer programs often demanding higher.
- Industrial manufacturing: 80% to 90%, reflecting longer and more variable lead times.
- Automotive Tier 1 suppliers: 90% to 96%, since just-in-time production punishes delays hard.
- Medical devices: 90% to 97%, where compliance and patient safety raise the bar.
- World-class performers across sectors: 95% or higher.
APQC’s own benchmarking data shows a median around 90% for orders delivered complete and on time, a useful midpoint to judge yourself against before chasing a specific sector figure. Set separate targets for full truckload versus less-than-truckload shipments, and for promotional surge orders versus steady replenishment, since lumping them together hides where you are actually failing.
Root causes and diagnostics across the order-to-delivery cycle
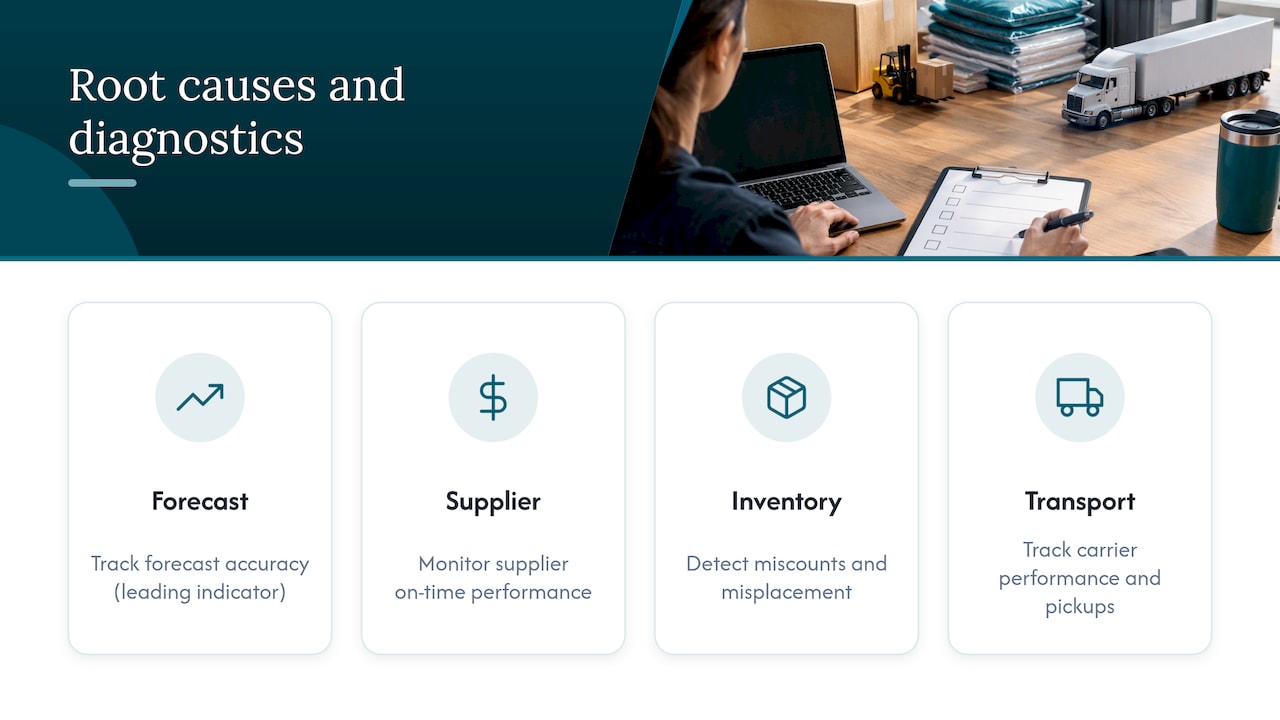
Late or incomplete deliveries usually trace back to one of five places: forecast error that leaves you short on inventory, supplier lead-time variance, inventory misplaced or miscounted in a warehouse, transport failures like missed pickups or carrier delays, or order processing delays before a shipment ever leaves the building.
Catching these early means watching leading indicators rather than waiting for OTIF to drop. Gartner’s framework on supply chain metrics recommends tracking forecast accuracy, supplier on-time performance, lead-time variability, and order cycle time alongside OTIF, because OTIF alone is a lagging number that tells you something already went wrong without telling you what. Real-time production and warehouse analytics can shorten the gap between a variance occurring and someone noticing it, which manufacturing analytics research ties directly to faster root-cause identification.
Once you spot a pattern, assign it to a process owner: procurement owns supplier variance, warehouse operations owns misplacement and pick accuracy, transportation owns carrier performance, and customer service or sales owns order entry delays. Diagnostics without ownership rarely produce lasting fixes.
A prioritized playbook for improving delivery performance
Fixes for OTD and OTIF split naturally into three horizons.
- This week: Tighten appointment scheduling with warehouses and customers, build a basic carrier scorecard so late patterns surface fast, and prioritize orders by committed date rather than order date when capacity is tight.
- This quarter: Reposition inventory closer to demand, adjust safety stock where lead-time variance is highest, and launch a formal supplier performance program with shared visibility into on-time rates.
- Over the next year: Invest in a transportation management system and warehouse management system that talk to each other, build supplier collaboration into planning cycles, and set up a recurring root-cause review loop fed by your BI dashboards rather than one-off spreadsheets.
Pro Tip: Review your OTD and OTIF numbers weekly at the process-owner level and monthly at the executive level. A weekly cadence catches a carrier problem before it becomes a quarter of lost penalties.
Our piece on improving customer delivery experience expands on sequencing these actions without overloading a team that is already stretched thin.
Tools and technology that move the needle on OTD
Different tools solve different failure modes, so matching the tool to the cause matters more than buying the most feature-rich option.
- Transportation management systems give you visibility and consolidated carrier booking, which addresses transport-stage failures.
- Warehouse management systems improve pick accuracy and inventory location, which addresses fulfillment-stage shortfalls.
- Carrier integration and real-time tracking platforms close the visibility gap between dispatch and delivery confirmation.
- Appointment scheduling tools reduce dock congestion and missed delivery windows at the receiving end.
- BI and analytics dashboards turn raw shipment data into the leading indicators you need for diagnosis, not just a lagging OTIF score.
Before buying, confirm the tool integrates with your existing order and carrier systems, supports the measurement level (order, line, or case) you actually need, and gives you exportable data rather than locking performance history inside a vendor dashboard. Our rundown of logistics technologies for supply chain professionals breaks these categories down further.
How Or-ner approaches OTD measurement and support
We built our platform around closing the gap between shipment data and the OTD or OTIF number a team actually needs. Our on-time delivery metrics resource walks through SQL-based calculations and a practical rule of thumb for flagging shipments once lateness exceeds a 25% threshold of the committed window. Because we handle freight booking, warehousing, and real-time tracking on one platform, we reduce the reconciliation work that normally happens when OTD data lives across separate carrier and warehouse systems.
What logistics managers should prioritize first
Start with definitions, not dashboards. Before week one ends, agree internally on which date counts as “on time” and whether you are measuring OTD or OTIF, since inconsistent definitions produce noise that masks real improvement. In quarter one, fix your worst leading indicator, usually supplier variance or order processing delay, rather than chasing the lagging OTIF number directly. Measure the same way every month or your trend line lies to you.
— Maayan
Get your on-time delivery assessment started
We help ecommerce sellers and manufacturers tighten freight booking, warehousing, and tracking into one measurable workflow. Start with Or-ner to request an on-time delivery assessment for your shipments.

FAQ
What is an example of on-time delivery performance?
Adding the OTIF condition, if 20 of those on-time orders were missing items, the OTIF drops to 88% on the same shipments.
How do you measure on time delivery?
You measure OTD by dividing the number of orders delivered by the committed date by the total number of orders shipped, then multiplying by 100, as MetricHQ’s formula outlines. Decide in advance whether you are measuring at the order, line, or case level, since each produces a different result from the same raw data.
How to evaluate delivery performance?
Evaluate delivery performance by tracking OTD or OTIF against a documented delivery window alongside leading indicators like forecast accuracy and supplier on-time rate. Gartner’s supply chain metrics guidance recommends pairing the lagging OTIF score with these input metrics so you can diagnose the cause, not just the symptom.
What is a good on-time delivery percentage?
A good OTIF typically falls between 85% and 97% depending on sector, with consumer packaged goods around 85% to 92% and medical devices closer to 90% to 97%. APQC’s benchmarking places the median near 90%, while world-class operations clear 95% or higher.
Sources
- OTIF: What It Is, How to Calculate It, and Why It’s the Metric That Actually Matters — Supply Chain Desk
- Defining ‘on-time, in-full’ in the consumer sector — McKinsey
- Percentage of orders delivered complete and on time (aka on time in full (OTIF)) — APQC
- On-time Delivery (OTD) – MetricHQ