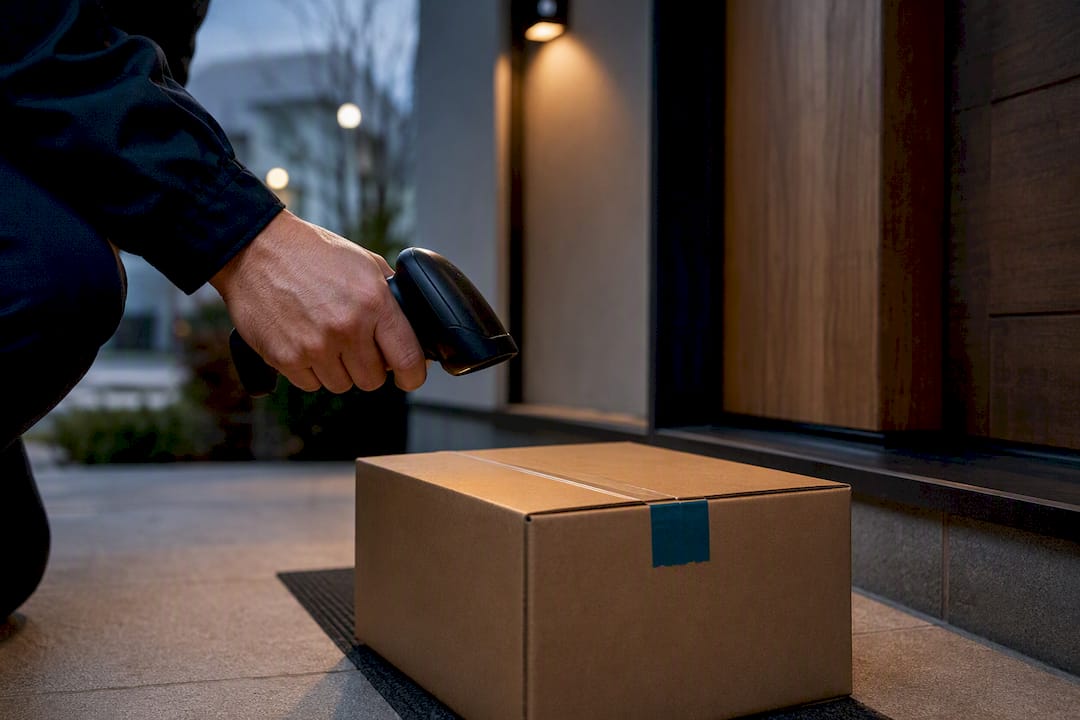
On-time delivery (OTD) is the percentage of orders that arrive on or before the date promised to the customer. The one number worth publishing alongside it is delivery-scan coverage, the share of shipments with a confirmed delivery scan feeding that rate. A high OTD rate sitting on low coverage is not good news. It is a data gap wearing a good score. Fixing tracking coverage should come before chasing the percentage itself.
TL;DR:
- Tracking coverage must be high enough to ensure the OTD rate reflects actual delivery performance rather than data gaps.
- Measuring delivery against the promised date frozen at ship time prevents trend distortion caused by carrier estimate updates.
- Segmenting OTD data by carrier, zone, and order complexity reveals operational issues hidden in national averages.
- Improving on-time rates requires shortening internal handling time, routing simple orders faster, and actively managing underperforming carriers.
- Regular reporting of OTD paired with coverage, reason codes, and segment analysis supports targeted actions to boost delivery reliability.
Table of Contents
- Defining On-Time Delivery Metrics: OTD, OTD Rate, and OTIF
- How to Calculate On-Time Delivery: Formulas and Coverage
- Data and Tracking Requirements for Accurate OTD Numbers
- Reporting and Segmenting Delivery Performance
- How to Improve On-Time Delivery Rates
- Making Your OTD Numbers Auditable
- Where Operations Teams Actually Draw the Line
- Get Help Improving Delivery Performance With Or-ner
- Sources
- FAQ
Defining On-Time Delivery Metrics: OTD, OTD Rate, and OTIF
OTD, as a concept, just means a shipment arrived by the date you told the customer to expect it. The metric that operations teams actually report is the OTD rate, and how you define its denominator changes the story the number tells.
- OTD rate measures the percentage of shipments delivered on or before the promised date, counted against shipments that have a confirmed delivery scan.
- OTIF (on time in full), also called DIFOT, adds a completeness check: the order arrived on time and with the full quantity ordered, no partial shipments or backorders.
- Order-level vs. shipment-level tracking matters because one order can split into multiple shipments. If you measure at the order level, a single late box can sink an otherwise on-time order.
Use OTD alone when you ship single-item or single-box orders and care mainly about transit reliability. Use OTIF when split shipments, backorders, or partial fulfillment are common, since APQC’s benchmarking data shows top performers hitting OTIF rates near 90%, a useful target if you’re building your own benchmark.
One more decision quietly shapes every number you report: whose “promise” are you measuring against? The date shown at checkout and the carrier’s estimated delivery date (EDD) are not the same thing, and mixing them mid-quarter will make your trend line lie to you.
How to Calculate On-Time Delivery: Formulas and Coverage
The canonical formula is straightforward: divide shipments delivered on or before the promised date by shipments that have a delivery scan recorded. That second part, the denominator, is where most companies get sloppy.
OTD rate = (shipments delivered on or before promised date) ÷ (shipments with a confirmed delivery scan) × 100
Shipments with no scan at all, lost, unscanned, or still in a data black hole, get excluded from the numerator and denominator both. That’s why you also need a second, separate number:
Delivery-scan coverage = (shipments with a delivery scan) ÷ (all shipments shipped) × 100
| Metric | What it answers | Typical use case |
|---|---|---|
| OTD rate (shipment-level) | Did this box arrive on time? | Single-item orders, carrier scorecards |
| OTD rate (order-level) | Did the whole order arrive on time? | Multi-item orders, customer-facing SLAs |
| OTIF | Did it arrive on time and complete? | B2B replenishment, retail vendor compliance |
| Delivery-scan coverage | How much of my shipment volume can I even measure? | Data quality check, run alongside every OTD figure |
Statistic worth remembering: industry guidance from Metabase explicitly warns against comparing historical shipments to a carrier’s live, constantly-updating EDD. Doing so retroactively inflates past performance every time the carrier revises its estimate, which corrupts trend analysis. Always freeze the promised date as it existed at ship time, then measure against that frozen snapshot forever after.
A basic SQL pattern captures this: join shipments to a promise table snapshotted at ship time, filter to rows with a non-null delivered_at timestamp, then compute the on-time flag as delivered_at <= promised_date_frozen. Coverage is simply the ratio of rows with a delivered_at value to total shipped rows in the same period.
Data and Tracking Requirements for Accurate OTD Numbers
Bad inputs produce a confident, wrong OTD rate. The fix starts with capturing the right events in the right order.
- Ship time: when the warehouse hands the parcel to the carrier, the moment you freeze the promised date.
- First carrier scan: confirms physical custody transferred and tracking has started.
- Delivered_at: the timestamp that closes the loop and lets a shipment enter your on-time calculation at all.
- Exception events: returned to sender, damaged, address correction, all of which need their own reason code rather than getting dumped into “delayed.”
Cleaning the data matters as much as capturing it. Deduplicate scans from carriers that post the same event twice. Drop shipments with no outcome recorded yet rather than counting them as on-time by default. And never let the promised date drift; once it’s frozen at ship time, it stays frozen even if the carrier later updates its own estimate.
The empirical evidence on delivery delay is worth internalizing here: across an analyzed sample of 3,842 orders, lead time correlated with delivery delay at r = 0.820, one of the strongest relationships in the study. That means a huge share of your late deliveries trace back to how long the order sat before it even shipped, not what happened in transit. A shipment tracking system that logs these events consistently is what makes the whole calculation trustworthy in the first place.
Pro Tip: *Never publish an OTD rate without its coverage number sitting right next to it.
Reporting and Segmenting Delivery Performance
A single company-wide OTD percentage hides more than it reveals. The teams that actually move the number report it segmented and paired with context metrics.
- Report the core pair every time: on-time percentage and delivery-scan coverage, never one without the other.
- Add operational context metrics: average handoff hours between pick and carrier pickup, and average days late for shipments that missed their window.
- Segment by carrier, service level, and destination zone: a national average can mask one regional carrier dragging the whole number down.
- Segment by SKU complexity and time window: bulky or multi-box items behave differently than small parcels, and week-over-week comparisons catch drift before a quarterly report does.
- Layer in reason codes: standardized taxonomies for late deliveries (carrier delay, address issue, weather, warehouse delay) let you prioritize fixes instead of guessing.
Weekly internal dashboards paired with monthly stakeholder reports strike a reasonable cadence for most operations. Set targets by segment, not company-wide. A delivery performance dashboard built around carrier and zone breakdowns will surface a struggling lane long before an aggregate number moves enough to raise alarms.
How to Improve On-Time Delivery Rates
Raising your OTD rate almost always comes down to shrinking the time between order placement and carrier handoff, then managing what happens once the shipment is in motion.
- Cut handoff time: align internal pick and pack SLAs with carrier pickup windows so orders aren’t waiting half a day for a truck that already left.
- Segment orders by complexity: route simple, single-SKU orders through a fast-track lane and reserve manual review for orders that genuinely need it.
- Build in buffer for known risk: peak season, remote zones, and multi-leg international routes all deserve wider promise windows rather than optimistic ones.
- Watch the 25% threshold: research on order processing found that once internal handling consumes more than roughly 25% of the total promised lead time, an order enters a danger zone where on-time delivery becomes statistically unlikely without intervention.
- Know when to stop chasing a lost cause: past more than half of promised lead time already consumed internally, the same research suggests it’s often smarter to deprioritize recovery on that one order and protect the shipments still inside their window.
- Manage carriers actively: score carriers by lane and service level, not as a single blended average, and renegotiate or shift volume away from consistent underperformers.
- Communicate exceptions early: a proactive delay notice does more for retention than a silent late delivery, since customer trust research links transparency directly to reduced churn after a missed promise.
Pro Tip: Run a small experiment before rolling out a fix fleetwide. Shift one carrier or one zone to a tighter handoff SLA for two weeks, compare its OTD rate to the control group, and only scale the change once the segmented data backs it up.
Fleet reliability plays into this too. Underperforming vehicles or inconsistent fuel efficiency practices in a private last-mile fleet can quietly erode handoff-to-delivery timing in ways that never show up until you segment by vehicle or route.
Making Your OTD Numbers Auditable
An OTD rate that nobody else can reproduce is just an opinion with a percent sign. Making the number defensible takes a few concrete habits.
- Always publish delivery-scan coverage next to the OTD rate so anyone reading the report can judge sample reliability.
- Freeze the promised date at ship time, every time, so the metric measures actual performance rather than a moving target.
- Use a standardized reason-code taxonomy for every late or excluded shipment, not a free-text field that six people fill in six different ways.
- Store the calculation logic (the SQL or ETL job) in a shared, versioned location so anyone can rerun the exact query on the exact data window.
- Document your sample size and reporting frequency, and run periodic spot audits comparing a manual sample against the automated number.
Where Operations Teams Actually Draw the Line
Every operations leader I’ve studied on this topic wrestles with the same tension: promise dates aggressive enough to win the sale, or conservative enough to protect the OTD rate. The honest answer is that the promise date matters less than what happens when it’s at risk.
Teams that communicate a delay early, before the promised window closes, tend to protect customer trust even when the shipment itself is late. Silence is what actually damages retention. Protecting the system beats rescuing the outlier.
— Maayan
Get Help Improving Delivery Performance With Or-ner
Publishing an accurate OTD rate is only useful if the operational reality behind it actually improves. Services exist that offer ecommerce sellers and logistics managers real-time shipment tracking, carrier coordination, and exception alerts that feed directly into the kind of frozen-promise, coverage-backed measurement this guide walks through, without building a custom data pipeline first.

If your delivery-scan coverage is too thin to trust your current OTD number, that’s usually a courier and tracking integration problem before it’s a reporting problem. Or-ner’s reliable courier services are built to close that gap, with consistent scan events and carrier accountability baked into the handoff. Get in touch to run a pilot on one lane or one carrier and compare the coverage and on-time numbers against what you’re tracking today.
Sources
- On-Time Delivery Rate: Definition, Denominator & SQL
- An Empirical Analysis of Delivery Delays in Supply Chain Management Using Business Intelligence Techniques
- Impact of On-Time Delivery on Supply
- Percentage of orders delivered complete and on time (aka on time in full (OTIF))
FAQ
What Is a Good On-Time Delivery Rate?
There’s no universal benchmark, but APQC’s data puts top-performing OTIF rates near 90%, a reasonable reference point once you segment by carrier and service level.
What’s the Difference Between OTD and OTIF?
OTD measures whether a shipment arrived by the promised date; OTIF adds a completeness check, confirming the order also arrived in full quantity with no partial shipments.
Why Does Delivery-Scan Coverage Matter?
Coverage shows what percentage of your shipments actually have a delivery outcome recorded, and a high OTD rate over low coverage is a weak, potentially misleading signal.
Should I Measure Against the Checkout Date or the Carrier’s EDD?
Freeze the promised date as it existed at ship time and measure against that snapshot, since comparing to a carrier’s live, updating EDD retroactively inflates historical performance.
How Often Should Operations Teams Report OTD?
Weekly internal tracking paired with monthly stakeholder reporting gives teams enough resolution to catch a declining lane before it shows up in a quarterly average.
Can Better Courier Coordination Improve My OTD Rate?
Yes. Tighter handoff SLAs and consistent carrier scan data, the kind Or-ner’s courier services are designed around, directly reduce the handoff delays that push orders into the early danger zone for lateness.