
TL;DR:
- Logistics service levels, such as OTIF, fill rate, and warehousing readiness, measure supply chain reliability and affect customer satisfaction and profitability.
- Effectively managing these metrics requires clear definitions, integrated data systems, and segment-specific targets to optimize costs and delivery performance.
- Choosing the right provider model and defining explicit SLAs help prevent operational blind spots and improve overall supply chain efficiency.
Logistics service levels are standardized performance metrics that quantify how reliably a supply chain fulfills customer orders on time and in full. For e-commerce businesses, these metrics are not abstract benchmarks. They directly determine whether customers reorder, whether 3PL contracts hold up under scrutiny, and whether your working capital is deployed efficiently. The three metrics that matter most are OTIF (On Time In Full), fill rate, and warehousing service level, also called delivery readiness. Understanding how each is defined, measured, and interconnected is the foundation of every supply chain decision worth making. Reliable logistics strengthen customer trust and directly affect long-term profitability.
What are the primary logistics service levels?
Logistics service levels explained at their core come down to three distinct but related measurements. Each answers a different operational question, and conflating them is one of the most common mistakes in supply chain management.
OTIF (On Time In Full) is the strictest metric. OTIF counts an order as successful only when it arrives within the agreed delivery window and contains the full quantity ordered. An order that arrives on time but is missing two units fails OTIF. An order that is complete but arrives one day late also fails OTIF. This binary pass/fail structure makes OTIF the most demanding and most revealing metric in logistics.
Fill rate answers a different question entirely. Fill rate measures the percentage of customer demand fulfilled completely from available inventory, without backorders or stockouts. It comes in three variants:
- Unit fill rate: the percentage of individual units shipped versus units ordered
- Line fill rate: the percentage of order lines fulfilled completely
- Order fill rate: the percentage of complete orders shipped without any shortfall
Each variant tells a different story. A high unit fill rate can mask a poor order fill rate if many orders are partially shipped. Order fill rate is the most customer-facing of the three.
Warehousing service level, also called delivery readiness, measures the ratio of completely satisfied orders to total orders requested from the warehouse. This metric isolates inventory and picking performance from transportation performance. When your OTIF score drops, warehousing service level tells you whether the failure originated in the warehouse or in transit.
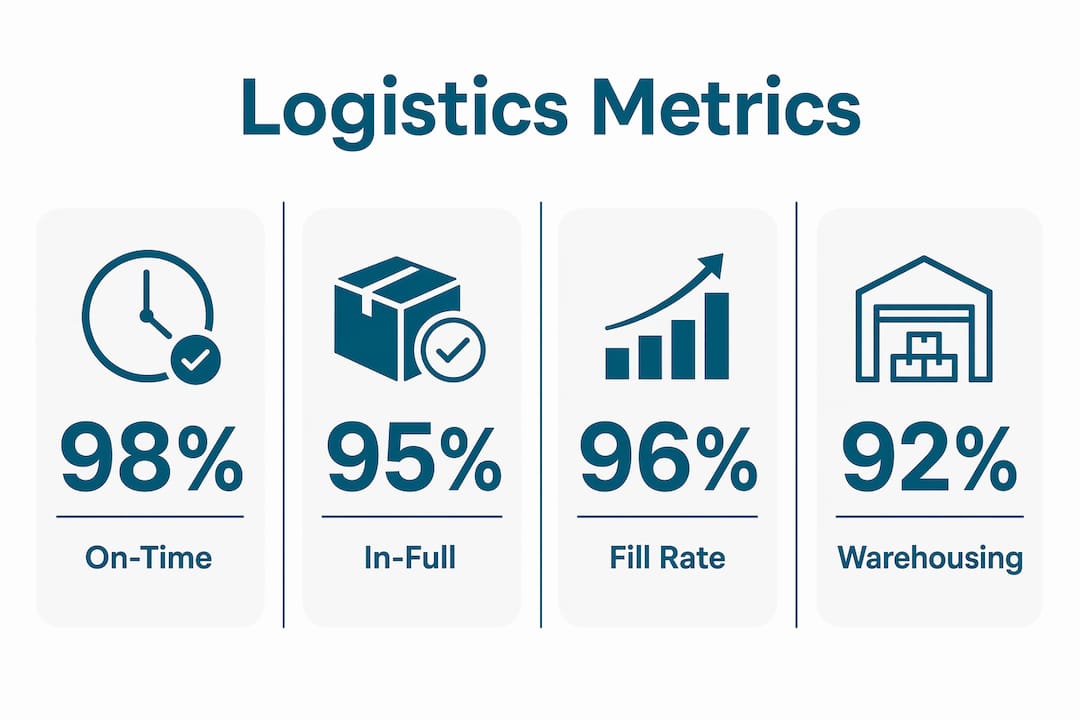
Together, these three metrics form a diagnostic system. OTIF tells you the outcome. Fill rate tells you about inventory availability. Warehousing service level tells you about operational readiness before the shipment leaves the dock.
How do service levels vary across 1PL to 5PL provider models?
The logistics provider model you choose determines who owns service level performance and how much complexity you can realistically manage. Each tier carries different SLA expectations.
| Provider model | Who manages logistics | Typical SLA focus | Service level complexity |
|---|---|---|---|
| 1PL (in-house) | The brand itself | Internal KPIs only | Low, full control |
| 2PL (carrier) | Transport provider | On-time delivery | Moderate, transport only |
| 3PL (third-party) | Outsourced fulfillment partner | OTIF, fill rate, pick accuracy | High, multi-function |
| 4PL (lead logistics) | Orchestrator managing 3PLs | End-to-end SLA governance | Very high, network-wide |
| 5PL (digital integrator) | Platform-driven, AI-optimized | Dynamic, real-time SLA management | Highest, fully integrated |
For most e-commerce businesses operating at scale, the 3PL relationship is where service level governance gets complicated. A 2026 dataset of 137 Shopify brands shows a median OTIF of 94.2% versus a contracted 98.0%, meaning the average 3PL is missing its SLA target by nearly four percentage points. That gap translates directly into failed customer promises.
Moving to a 4PL or 5PL model shifts SLA ownership to the provider, but it also reduces your visibility into root causes. Brands that outsource logistics governance entirely often discover service level problems only after customer complaints surface, not from proactive data monitoring.
Pro Tip: Before signing a 3PL contract, define OTIF tolerance windows explicitly. Specify what “on time” means in hours, not just days, and document exception handling procedures for weather delays and carrier failures. Ambiguity in these definitions is the single largest source of SLA disputes.
What operational challenges prevent high service levels?
Achieving consistent OTIF above 95% requires more than good intentions. High OTIF scores require integrated systems for delivery planning, real-time tracking, and proactive exception management. Most operations that fall below 90% share the same cluster of root causes.
The most common failure points, ranked by frequency in practice:
- Undefined SLA terms. When “on time” means different things to the shipper, the 3PL, and the carrier, every performance review becomes a negotiation rather than an accountability conversation. Standardized SLA definitions are the prerequisite for any meaningful measurement.
- Disconnected systems. Order management, warehouse management, and transport management systems that do not share data in real time create blind spots. A warehouse may confirm a shipment as dispatched while the carrier has not yet collected it. That gap destroys OTIF accuracy.
- Manual route planning. Carriers relying on static route plans cannot adapt to traffic, access restrictions, or address errors. Integrating driver navigation apps with precise address data and route optimization reduces dwell time and last-mile delays significantly.
- Inaccurate inventory records. If your warehouse management system shows stock that does not physically exist, pick failures cascade into order fill rate problems before any shipment leaves the building.
- No leading indicator monitoring. Most operations measure OTIF after delivery. By then, the failure has already happened. Dock-to-stock and pick/pack accuracy act as leading indicators that signal deterioration before it reaches the customer.
Pro Tip: Set up weekly reviews of pick and pack accuracy and inventory record accuracy alongside OTIF. These upstream metrics give you a two-to-five day warning window to intervene before a service level miss becomes a customer complaint.
Fixing these issues does not require a full technology overhaul. Start with a shared data layer between your OMS and WMS, define SLA terms in writing with your carrier, and add one leading indicator to your weekly operations review. Those three changes address the majority of OTIF failures in mid-market e-commerce operations.
How do service level targets affect costs and customer satisfaction?
Every service level target carries a cost. The relationship between target service level and safety stock is not linear. It follows a statistical curve tied to Z-scores. A 95% service level corresponds to a Z-score of approximately 1.65, meaning you are holding enough buffer stock to cover demand variability in 95 out of 100 replenishment cycles. Pushing that target to 99% raises the Z-score to 2.33, requiring substantially more safety stock and the working capital to fund it.
| Service level target | Z-score | Stockout risk | Safety stock impact |
|---|---|---|---|
| 90% | 1.28 | 10% | Moderate buffer |
| 95% | 1.65 | 5% | High buffer |
| 98% | 2.05 | 2% | Very high buffer |
| 99% | 2.33 | 1% | Extreme buffer |
The implication is direct: a blanket 99% service level target across your entire catalog is a capital allocation decision, not just a logistics decision. Applying that target to slow-moving SKUs ties up cash that could fund growth elsewhere.
The customer satisfaction dimension is equally concrete. Accurate order updates and clear communication increase repeat business, and repeat customers cost significantly less to retain than new customers cost to acquire. Missing a service level target once may be forgiven. A pattern of misses erodes the trust that drives lifetime customer value.
The practical answer is segment-specific targets. High-velocity, high-margin SKUs warrant a 98% or 99% service level with the safety stock to match. Slow-moving or low-margin items can operate at 90% to 95% without meaningful customer impact. This approach, supported by inventory policies aligned to customer expectations by segment, maximizes capital efficiency without sacrificing the customer experience where it counts most. You can explore how to track these outcomes in detail through Or-ner’s guide on delivery performance metrics.
Key takeaways
Effective logistics service level management requires clear metric definitions, integrated data systems, and segment-specific targets rather than uniform standards across all SKUs.
| Point | Details |
|---|---|
| OTIF is binary | An order must be both on time and complete to pass; partial success counts as failure. |
| Fill rate and OTIF are distinct | Fill rate measures inventory availability; OTIF measures the customer delivery outcome. |
| Provider model shapes SLA ownership | Moving from 3PL to 4PL shifts governance but reduces direct visibility into root causes. |
| Safety stock scales with targets | Raising service level from 95% to 99% requires a substantially larger inventory buffer. |
| Leading indicators prevent failures | Monitoring pick accuracy and dock-to-stock time catches problems before OTIF deteriorates. |
Why uniform service level targets are a capital trap
I have reviewed logistics contracts for brands across apparel, home goods, and consumer electronics, and the same mistake appears repeatedly. A decision-maker sets a single OTIF target, say 98%, applies it to every SKU in the catalog, and then wonders why working capital is perpetually strained. The target itself is not the problem. Applying it uniformly is.
The most effective operations I have seen treat service level targets as a portfolio decision. They segment SKUs by velocity, margin, and customer sensitivity, then assign differentiated targets. A best-selling product with high customer visibility gets a 99% target with the safety stock to back it. A slow-moving accessory gets a 92% target and a leaner buffer. The aggregate service level across the catalog looks similar, but the capital efficiency is dramatically better.
The second pattern I see consistently is technology investment without definition discipline. Companies deploy warehouse management systems, real-time tracking tools, and route optimization platforms, then continue arguing with their 3PL about whether a delivery was “on time” because the SLA never defined the measurement timestamp. Technology amplifies the processes you already have. If the definition is ambiguous, better data just surfaces the ambiguity faster.
My recommendation: before your next contract renewal or technology investment, spend two hours writing down exactly what “on time” and “in full” mean for your operation. Define the timestamp, the tolerance window, and the exception criteria. That document is worth more than most software implementations. You can also review how measuring delivery performance works in practice before setting those definitions.
— Maayan
How Or-ner helps you hit your service level targets
Or-ner’s global logistics platform is built for e-commerce businesses that need more than a carrier. The platform connects real-time shipment tracking, route optimization, and warehouse management into a single data layer, giving you the visibility to catch OTIF exceptions before they reach the customer. Whether you are managing cross-border freight, last-mile delivery, or multi-warehouse fulfillment, Or-ner’s courier services platform gives you the tools to define, monitor, and consistently hit your service level agreements. For operations looking to reduce logistics costs while maintaining delivery reliability, Or-ner’s cloud logistics platform delivers measurable efficiency gains across the full fulfillment cycle.
FAQ
What does OTIF mean in logistics?
OTIF stands for On Time In Full. An order passes OTIF only when it arrives within the agreed delivery window and contains the complete quantity ordered. Missing either condition counts as a failure.
What is the difference between fill rate and service level?
Fill rate measures the percentage of demand fulfilled from available inventory without backorders. Service level, specifically OTIF, measures whether the customer received the right order at the right time. Fill rate is an inventory metric; OTIF is a delivery outcome metric.
What is a good OTIF score for e-commerce?
Industry benchmarks place strong performance above 95%. A 2026 study of 137 Shopify brands found a median OTIF of 94.2% against contracted targets of 98.0%, showing that most 3PL providers fall short of their SLA commitments.
How does service level affect safety stock?
Higher service level targets require more safety stock to cover demand variability. A 95% target corresponds to a Z-score of 1.65, while a 99% target requires a Z-score of 2.33, meaning significantly more inventory buffer and working capital.
What is warehousing service level?
Warehousing service level, also called delivery readiness, measures the ratio of completely satisfied orders to total orders requested from the warehouse. It isolates inventory and picking performance from transportation performance, helping identify where in the supply chain failures originate.