End-to-end supply chain solutions are integrated systems that connect every operational stage from supplier sourcing through post-sale returns into a single, governed program. The practical payoff is direct: fewer handoff failures, less value leakage between functions, and measurable improvements in OTIF (on-time in-full) and cash-to-cash cycle time. According to KPMG’s 2026 survey of 462 senior executives, 38% of organizations cite logistics and transportation costs as their largest source of value leakage — the exact gap that a well-designed E2E program targets.
Three capabilities anchor any credible E2E program: an ERP as the system of record, a TMS and WMS for execution, and a visibility layer that surfaces exceptions before they become delays. Without all three talking to each other, you have functions, not a supply chain.
Key Takeaways
A successful E2E supply chain program starts with clean master data and a single pilot lane, not enterprise-wide technology deployment.
| Point | Details |
|---|---|
| Start with data, not software | Align item, supplier, and shipment identifiers across ERP, WMS, and TMS before any integration work begins. |
| Pilot one lane in 90 days | Baseline data in days 0–30, activate real-time tracking in days 31–60, run exception playbooks in days 61–90. |
| Track three outcome KPIs first | OTIF, inventory turns, and cash-to-cash cycle tell you whether the program is delivering value before you add more metrics. |
| Budget shifted to 11–15% of spend | KPMG’s 2026 survey shows companies increased supply chain investment from 5–10% in 2024 to 11–15% in 2026. |
| Or-ner covers freight execution | Or-ner provides freight booking, real-time tracking, customs clearance, and warehousing to support pilot lane execution. |
Table of Contents
- What are end-to-end supply chain solutions, and what do they cover?
- How does end-to-end visibility actually work?
- What business benefits can you realistically expect?
- What are the biggest pitfalls when moving to E2E?
- Which technology systems do you actually need?
- How do you implement an E2E supply chain program step by step?
- Which KPIs should you track, and what do they tell you?
- What optimization tactics actually move the needle?
- What does 2026 research say about E2E program priorities?
- The tradeoffs nobody talks about in E2E programs
- Or-ner covers the logistics layer your E2E program depends on
- Sources
- FAQ
What are end-to-end supply chain solutions, and what do they cover?
The industry term is end-to-end supply chain management, often shortened to E2E SCM. The “end-to-end” framing matters because it signals scope: the program covers every stage from raw material sourcing to the customer’s door and the return trip back, not just the warehouse or the last mile.
Here is what each stage owns and who typically runs it:
- Sourcing and procurement — supplier selection, purchase orders, contracts, and inbound quality. Owned by the procurement team; primary KPI is purchase price variance and supplier on-time delivery.
- Inbound logistics — freight from supplier to plant or DC, including customs clearance and carrier management. Owned by logistics or supply chain operations; KPI is inbound freight cost per unit and lead time variance.
- Manufacturing or contract manufacturing — production scheduling, capacity planning, and quality control. Owned by operations or a contract manufacturer; KPI is production yield and schedule adherence.
- Warehousing and inventory management — receiving, putaway, cycle counting, and replenishment. Owned by warehouse operations; KPIs are inventory accuracy, days on hand, and fill rate.
- Outbound logistics and distribution — order picking, carrier selection, and shipment execution. Owned by logistics; KPI is cost per shipment and order cycle time.
- Last-mile delivery — final carrier handoff to the end customer, including delivery confirmation and exception handling. Owned by logistics or a 3PL partner; KPI is OTIF and delivery attempt rate.
- Customer service and returns — post-delivery inquiries, claims, and reverse logistics. Owned by customer service and logistics jointly; KPIs are return rate, credit cycle time, and net promoter score.
The Global Supply Chain Institute at the University of Tennessee frames E2E planning as a discipline that ties design, procurement, and execution together through continuous improvement cycles — not a one-time technology deployment. That framing is worth keeping in mind before you buy software.
How does end-to-end visibility actually work?
Visibility is the nervous system of an E2E program. Without it, you are managing by exception only after the exception has already cost you money.
A mature visibility setup delivers three things: a single timeline of truth across all carriers and nodes, predictive ETAs that flag a delay before the customer notices, and actionable alerts routed to the right person with a defined response. Inbound Logistics notes that sensor fusion, AI, and connected partner data are central to predictive analytics and control tower workflows that materially improve resilience and exception handling.

The data sources that feed this layer include ERP (orders, inventory positions), WMS (warehouse events), TMS (shipment milestones), carrier APIs (real-time location pings), IoT and telemetry (temperature, humidity, shock sensors), customs systems (clearance status), and OMS (order orchestration). The critical technical detail most teams underestimate: canonical identifiers. Every event feed needs to carry the same order number, shipment ID, and SKU code that your ERP uses. Without that alignment, carrier pings become noise rather than context. You can explore supply chain visibility tools that help logistics teams align these identifiers across systems.
A control tower sits above these feeds. Its job is event ingestion, anomaly detection, and alert routing. The architecture is straightforward in concept: master data flows in, events are matched to orders and shipments, analytics flags deviations, and the exception is pushed back into the TMS or ERP with a suggested action. What separates a useful control tower from a dashboard graveyard is the exception playbook. Practitioners consistently report that dashboards without defined response protocols create notification noise; teams must assign ownership and pre-define the response for each alert type before the system goes live.
Pro Tip: Before you configure a single alert, write the playbook first. Define who receives the alert, what action they take within what time window, and how escalation works. A control tower without playbooks is just an expensive screen.
What business benefits can you realistically expect?
Five value streams show up consistently in E2E programs that reach maturity:
- Reduced expedited freight and value leakage — when visibility catches delays early, teams reroute or expedite selectively rather than reactively. This directly addresses the 38% of leaders who identify logistics costs as their primary leakage source.
- Better customer experience — accurate ETAs and proactive exception communication reduce inbound contacts and improve OTIF. Tracking improvements can be a quick win; shipment tracking best practices give a practical starting point.
- Inventory efficiency — integrated demand signals from OMS and ERP reduce safety stock requirements and improve inventory turns.
- Supply chain resilience — scenario modeling and supplier diversification data let teams respond to disruptions in hours rather than days.
- Faster decision cycles — a shared data layer eliminates the weekly “data reconciliation” meeting and lets managers act on the same numbers at the same time.
Consider a mid-market distributor running separate TMS and ERP systems with no shared identifiers. Inbound delays were invisible until a customer called. After connecting the systems through a visibility layer and defining five exception playbooks, the team cut reactive expedite spend and reduced OTIF misses within two quarters. The technology cost was modest; the process redesign took longer.
What are the biggest pitfalls when moving to E2E?
Most E2E programs stall on four obstacles, and none of them are primarily technology problems.
Data silos and master-data mismatch are the most common. Supplier codes in the ERP do not match the codes in the WMS; shipment IDs in the TMS are not linked to purchase orders. The mitigation is a data cleansing sprint before any integration work begins: audit your item master, supplier master, and location codes across all systems and enforce a single canonical identifier.
Legacy ERP constraints slow integration because older systems lack APIs or require expensive middleware. A phased approach works better than a full replacement: connect the visibility layer via EDI or flat-file first, then migrate to API-based integration as budget allows.
Change management and talent gaps are where programs quietly die. KPMG’s 2026 data shows 77% of supply chain leaders report a significant talent shortage in procurement and supply chain functions. The operational fix is a cross-functional squad model: pull one person from procurement, logistics, IT, and finance into a dedicated program team rather than asking functional managers to run integration work on top of their day jobs. A steering committee with an executive sponsor who can resolve cross-functional disputes is not optional. For a deeper look at the talent challenge, the supply chain talent shortage guide covers hiring and retention strategies in detail.
Upfront integration costs surprise teams that underestimate the middleware, data cleansing, and change management work. Budget for these explicitly in phase one, before any AI or analytics layer is added.
Which technology systems do you actually need?
The architecture has three layers: systems of record, execution engines, and the visibility and analytics layer.
Systems of record anchor the data model. The ERP (owned by finance and supply chain planning) holds orders, inventory positions, supplier records, and financials. The OMS (owned by commercial operations) orchestrates order routing and allocation logic.
Execution engines move goods and information. The TMS (owned by logistics) handles carrier selection, rate management, and shipment execution. The WMS (owned by warehouse operations) manages receiving, putaway, picking, and shipping. These two systems generate the event streams that feed visibility.
Visibility and analytics layer aggregates carrier APIs, IoT telemetry, customs status, and ERP/WMS/TMS events into a unified timeline. This is where transport data analytics turns raw event feeds into decision intelligence.
On integration options: APIs offer real-time latency and are the right choice for carrier tracking and order status. EDI remains the standard for purchase orders and advance ship notices with suppliers who cannot support APIs. Flat-file batch transfers are acceptable for low-frequency data like weekly inventory snapshots but create lag that undermines real-time visibility.
The build-versus-buy question is simpler than it sounds. Buy execution systems (TMS, WMS, ERP) from established vendors; the configuration cost is lower than building from scratch. For the visibility layer, purpose-built platforms aggregate carrier APIs faster than internal teams can. Build only when your process is genuinely differentiated and no vendor covers it.
Where AI adds value versus where it does not: AI-driven demand forecasting and dynamic routing optimization deliver measurable results when the underlying data is clean and the process is standardized. Supply Chain Management Review is direct on this point: firms must standardize processes, clean data, and establish governance before scaling AI. SupplyChainBrain confirms that while more than half of firms deploy AI in some form, fewer than one in 10 have scaled pilots enterprise-wide, and 74% remain at the planning stage or without a clear roadmap. AI on top of bad data produces confident wrong answers.
How do you implement an E2E supply chain program step by step?
Accenture’s February 2026 Digital Supply Chain Study puts typical time-to-value at 12–18 months, with complexity (SKU count, network scale) driving the timeline. A focused mid-market pilot can show measurable results in 90 days if scope is disciplined.
- Assess data maturity (weeks 1–3). Audit item master, supplier master, and location codes across ERP, WMS, and TMS. Score each system on data completeness and identifier consistency. This assessment determines your integration sequence.
- Map current-state processes (weeks 2–4). Document every handoff between procurement, logistics, warehouse, and customer service. Identify where data is re-keyed, where identifiers break, and where decisions are made without shared data.
- Define KPIs and targets (week 4). Agree on three to five outcome metrics (OTIF, inventory turns, cash-to-cash cycle) with owners and baseline values before any system work begins.
- Clean master data (weeks 3–6). Standardize item codes, supplier codes, and location identifiers across all systems. This is the unglamorous work that determines whether your integration delivers signal or noise.
- Stand up a pilot lane (weeks 5–10). Select one trade lane, one supplier, or one product category. Connect TMS and ERP via API or EDI. Instrument the visibility layer for that lane only. Logicom Hub’s staged approach recommends days 0–30 for baselining and piloting one lane, days 31–60 for lighting up real-time tracking and dashboards, and days 61–90 for running exception playbooks and planning scale-out.
- Instrument the control tower and run exceptions (weeks 8–14). Write five to ten exception playbooks before the control tower goes live. Assign owners. Run the pilot lane through the playbooks and measure response time and resolution rate.
- Scale and govern (months 4–18). Expand lane by lane. Establish a monthly steering committee review cadence. Promote the program lead to a permanent supply chain excellence role.
Governance roles
| Role | Decides | Executes | Measures |
|---|---|---|---|
| Executive sponsor | Budget, cross-functional escalations | Removes organizational blockers | Program ROI vs. plan |
| Program lead | Scope, sequencing, vendor decisions | Runs the cross-functional squad | Milestone completion, KPI trends |
| Data owner | Master data standards and governance rules | Manages data cleansing and stewardship | Data quality scores |
| Operations owner | Process design and exception playbooks | Runs day-to-day execution in the pilot lane | OTIF, fill rate, exception resolution time |
Which KPIs should you track, and what do they tell you?
Prioritize three outcome KPIs first: OTIF, inventory turns, and cash-to-cash cycle. Everything else is a diagnostic.
| Metric | Formula | Typical target | What a change signals |
|---|---|---|---|
| OTIF (on-time in-full) | (Orders delivered on time AND in full) / Total orders | 90%+ for B2B | Drop signals carrier, warehouse, or demand-planning failure |
| Inventory turns | Cost of goods sold / Average inventory value | 6–12x for consumer goods | Rising turns = less capital tied up; falling turns = overstock or demand miss |
| Cash-to-cash cycle | Days inventory outstanding + Days sales outstanding – Days payable outstanding | Varies by industry; lower is better | Shortening cycle improves working capital; lengthening signals process or payment delays |
| Fill rate | Units shipped / Units ordered | 90%+ | Drop signals stockout or allocation failure |
| Perfect order rate | Orders with no errors (on time, complete, undamaged, correct invoice) | 90%+ | Composite signal for overall E2E health |
On cadence: real-time alerts belong in the control tower for OTIF and exception events. Weekly scorecards work for fill rate and perfect order. Cash-to-cash is a monthly finance metric. The most common measurement pitfall is definition mismatch: one team counts OTIF against the original promise date; another counts it against the revised date. Align definitions in writing before you baseline.
Pro Tip: Lock down your OTIF definition in a one-page data dictionary before the pilot starts. “On time” measured against the original promise date versus the revised date can produce a 15-point difference in the same dataset.
What optimization tactics actually move the needle?
Short-cycle tactics you can start in the next 30 days:
- Run S&OP alignment weekly, not monthly. Monthly S&OP cycles create a three-week window where demand signals and supply plans diverge. Weekly cadence catches mismatches before they become expedite orders.
- Segment your supplier base. Tier suppliers by volume, risk, and lead-time variability. Invest collaboration resources (joint forecasting, VMI) in the top 20% that drive 80% of your spend. For supply chain cost reduction, supplier segmentation is one of the highest-leverage levers.
- Segment inventory by demand pattern. Fast-moving, predictable SKUs need lean safety stock. Slow-moving or seasonal SKUs need different replenishment logic. Mixing them in a single policy wastes capital.
- Write exception playbooks before you need them. Define the five most common exceptions (late inbound shipment, stockout alert, carrier delay, customs hold, return spike) and assign an owner and a response time to each.
- Pilot visibility on one lane before scaling. A single lane pilot surfaces integration problems at low cost and builds organizational confidence.
When E2E is implemented well, roles shift. Logistics managers spend less time on status calls and more time on exception resolution and continuous improvement. Procurement analysts move from reactive PO management to supplier performance coaching. That shift requires deliberate role redesign, not just new software. The Global Supply Chain Institute frames this as the difference between a planning discipline and a technology deployment.
What does 2026 research say about E2E program priorities?
Three findings from current research should change how you sequence your program.
First, budgets are moving. KPMG’s 2026 survey of 462 senior executives found companies increased supply chain investment to 11–15% of their budget, up from 5–10% in 2024. That budget shift creates a window to fund data foundations and governance work that previously lost out to operational spending.
Second, talent is the binding constraint. With 77% of leaders reporting a significant talent shortage, hiring your way to E2E capability is not a realistic plan. The practical response is to design the program around a small, dedicated cross-functional squad and invest in upskilling existing staff on data literacy and exception management, rather than waiting for specialized hires.
Third, AI pilots are not scaling. SupplyChainBrain’s research shows fewer than one in 10 firms have scaled AI enterprise-wide. Supply Chain Management Review is clear on why: AI requires standardized processes, clean data, and governance to deliver sustainable value. Spending on AI before those foundations are in place produces pilots that impress in demos and stall in production.
The prioritization implication is direct: spend the first budget tranche on data cleansing, master data governance, and a pilot lane with defined playbooks. The second tranche funds the visibility layer and control tower. AI-driven forecasting and optimization come third, once the data is trustworthy.
The tradeoffs nobody talks about in E2E programs
The standard advice on E2E programs is to go big, move fast, and integrate everything. Real operations rarely cooperate with that plan.
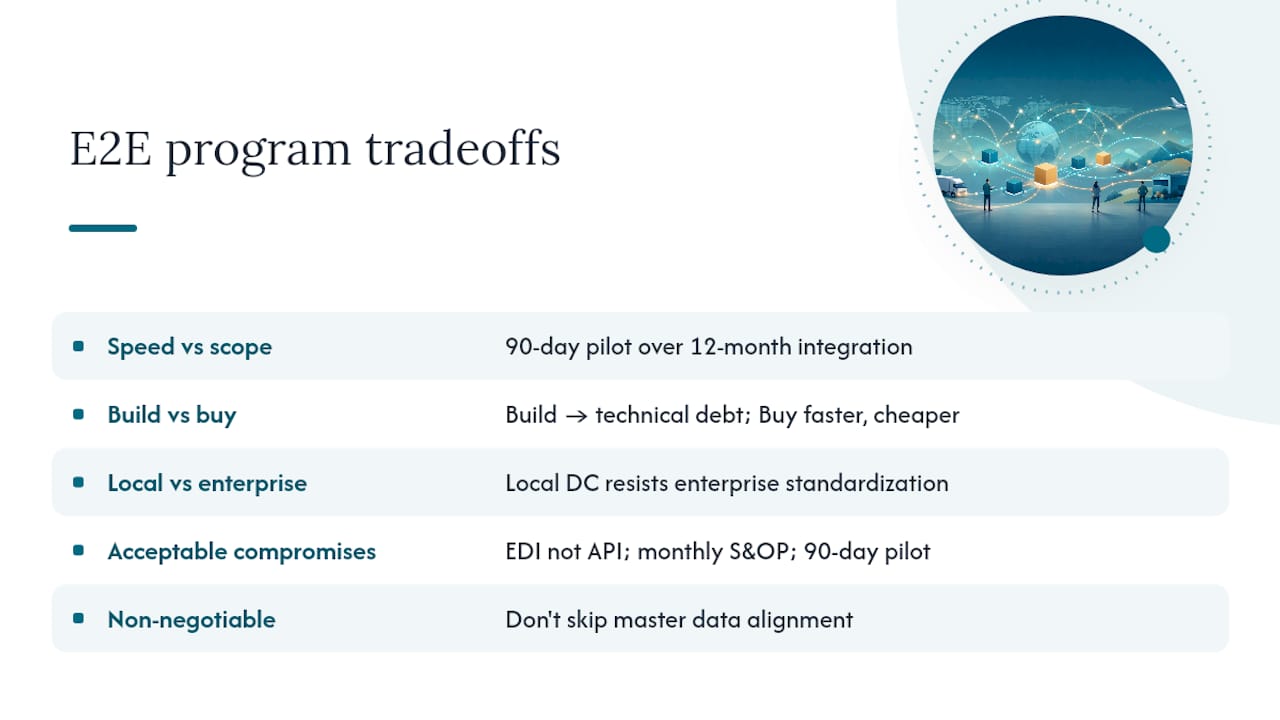
The most honest framing: a well-scoped pilot on one lane with clean data and five exception playbooks will deliver more measurable value in 90 days than a 12-month enterprise-wide integration that tries to solve every problem at once. Speed and scope are genuinely in tension, and scope almost always wins the wrong way — programs expand before the foundation is solid, and the result is a visibility layer that shows you more problems than your team can respond to.
The build-versus-buy tradeoff is similarly misread. Teams that build custom integrations to avoid vendor lock-in often end up locked into their own technical debt instead. Buying a purpose-built TMS or visibility platform and configuring it to your process is faster and cheaper in almost every mid-market scenario. The exception is when your process is genuinely differentiated — and most supply chain processes are not.
Local optimization versus enterprise standardization is the political fight that kills more programs than any technology failure. A regional DC that has optimized its own WMS configuration will resist a standard that serves the enterprise but costs them local efficiency. The steering committee’s job is to make that call explicitly, not to let it fester as a passive-aggressive integration delay.
Realistic compromises that are acceptable: starting with EDI instead of API when a supplier cannot support real-time integration; running monthly S&OP instead of weekly when the team lacks the data infrastructure for weekly; accepting a 90-day visibility pilot on one lane before committing to a full rollout. What is not acceptable is skipping master data alignment and hoping the integration layer will sort it out.
Or-ner covers the logistics layer your E2E program depends on
The implementation roadmap above assumes you have reliable freight execution, real-time shipment tracking, and customs clearance working before you build the analytics layer on top. For ecommerce and retail businesses, that execution layer is where Or-ner operates.
Or-ner handles freight booking across ocean, air, and land modes, real-time shipment tracking with exception alerts, customs clearance and documentation, cross-border logistics, and warehousing and fulfillment for ecommerce sellers including Amazon-integrated operations. These capabilities map directly to the inbound logistics, outbound logistics, last-mile, and visibility phases of the roadmap covered above. If your pilot lane involves cross-border freight or ecommerce fulfillment, Or-ner’s platform gives you the execution infrastructure and tracking data your control tower needs without building carrier integrations from scratch.
The practical next step is to run a freight pilot on one lane. Start with Or-ner’s step-by-step freight booking guide to scope the pilot, connect your first carrier feed, and get real shipment data flowing into your visibility layer within 30 days.
Sources
- KPMG – Risk management & supply chain resilience
- AI won’t fix a broken supply chain foundation – Supply Chain Management Review
- Accenture – Digital Supply Chain Study – Feb 2026
- A New Report Reveals Why So Many AI Projects Are Failing to Launch in Supply Chains | SupplyChainBrain
- End-to-End Visibility: The See-Through Supply Chain | Inbound Logistics
FAQ
What is E2E supply chain analysis?
E2E supply chain analysis maps every stage from procurement through post-sale returns, measures performance at each handoff, and identifies where cost, time, or quality is lost. It uses data from ERP, TMS, WMS, and carrier systems to produce a single view of flow, cost, and risk across the full chain.
What is end-to-end visibility in supply chain?
End-to-end visibility means tracking every order, shipment, and inventory position across all nodes and carriers in real time, with predictive alerts when a deviation is detected. It requires canonical identifiers shared across ERP, WMS, and TMS so that carrier events are matched to orders automatically rather than manually reconciled.
How do you optimize an end-to-end supply chain?
Start with master data alignment and a single pilot lane, then add a visibility layer with defined exception playbooks before scaling. Short-cycle wins include weekly S&OP cadence, supplier segmentation, and inventory policy differentiation by demand pattern.
What are the 5 Ws of supply chain management?
The 5 Ws frame supply chain decisions as: What to produce or stock, Where to source and store it, When to order and ship, Who owns each stage and handoff, and Why each decision rule exists. Applying this framework to each stage of an E2E program clarifies ownership and exposes gaps in governance.
How long does an E2E supply chain implementation take?
A focused pilot on one lane can show measurable results in 90 days.