
Supplier delivery performance measures whether a vendor delivers the right quantity, at the promised time, in usable condition. The single metric to prioritize is OTIF (on-time, in-full): it catches both timing failures and quantity shortfalls that on-time delivery alone misses. Build your scorecard around OTIF, then layer in OTD, fill rate, lead-time variance, and ASN accuracy for a complete diagnostic picture.
TL;DR:
- OTIF offers the most comprehensive measure by combining delivery timeliness and full order fulfillment, with world-class scores around 95 to 98 percent.
- Tolerance windows significantly affect scores: a narrower window, such as ±1 day, can increase late delivery counts, while a wider window reduces them, making comparisons less meaningful.
- Data sources like ERP receipts, ASN notices, warehouse timestamps, and carrier tracking must be cleaned and reconciled regularly to ensure accurate metrics.
- Scorecards should weight delivery performance heavily, typically around 40 percent, and be reviewed monthly for critical suppliers to enable quick corrective actions.
- Immediate responses to delivery slips include expediting shipments, root cause analysis, corrective action requests, and reconsideration of sourcing strategies for habitual offenders.
Table of Contents
- Core Delivery Metrics Procurement Must Track
- How to Calculate Delivery Metrics: Formulas and Tolerance Windows
- What Delivery Benchmarks Should You Target?
- Where Delivery Data Actually Comes From
- Turning Metrics Into a Supplier Scorecard
- What to Do When Delivery Performance Slips
- How Or-ner Approaches Delivery Measurement in Practice
- What Most Scorecards Get Wrong
- How Or-ner Helps You Close the Gap Between Metric and Action
- Sources
- FAQ
Core Delivery Metrics Procurement Must Track
A supplier can hit “on time” and still wreck your production schedule if the shipment arrives three units short. That’s why procurement teams stack several metrics rather than trusting one number.
OTIF (on-time, in-full) combines the two things that matter most: did the order arrive when promised, and was the full quantity there? A supplier can post 97% OTD and still score poorly on OTIF if partial shipments are common.
OTD (on-time delivery) tracks timing only. It’s the older, simpler metric and still useful for isolating carrier or scheduling problems separate from quantity issues.
Fill rate / order accuracy measures whether the correct items and quantities shipped, regardless of timing. Partial deliveries drag this number down even when the supplier technically met the date.
Lead time and lead-time variance matter more than average lead time alone. A supplier averaging 10 days but swinging between 4 and 18 days is far riskier to plan around than one that reliably delivers in 12.
ASN accuracy and first-attempt delivery round out the set. An advance shipping notice that doesn’t match the physical goods receipt corrupts your OTIF math before the truck even arrives, and monitoring ASN accuracy as a distinct indicator catches that problem early.
- OTIF: timing + quantity combined, your headline KPI
- OTD: timing only
- Fill rate: quantity/accuracy only, ignores timing
- Lead-time variance: consistency, not just speed
- ASN accuracy: data integrity underlying every other metric
- Defect rate: quality failures tied to the delivery event
How to Calculate Delivery Metrics: Formulas and Tolerance Windows
Every metric above needs a formula procurement can drop into a spreadsheet without ambiguity. Here’s the working set:
- OTD = (Orders delivered on or before the agreed date ÷ Total orders) × 100
- OTIF = (Orders delivered on time AND in full ÷ Total orders) × 100
- Fill rate = (Units shipped ÷ Units ordered) × 100
- Perfect order rate = (Orders with no errors in timing, quantity, documentation, and damage ÷ Total orders) × 100
- Defect rate (PPM) = (Defective units ÷ Total units shipped) × 1,000,000
- Lead-time coefficient of variation (CV) = (Standard deviation of lead time ÷ Mean lead time) × 100
Tolerance windows change your results dramatically, so define one before you calculate anything. The Odette LK03 standard treats delivery accuracy as measured against a firm delivery date and firm quantity, with explicit tolerance rules baked into the rating. A ±1 day window on a 100-order sample might flag 12 late deliveries; loosen it to ±3 days and that number can drop below 4. Neither is “wrong,” but comparing suppliers across different windows produces meaningless scorecards.
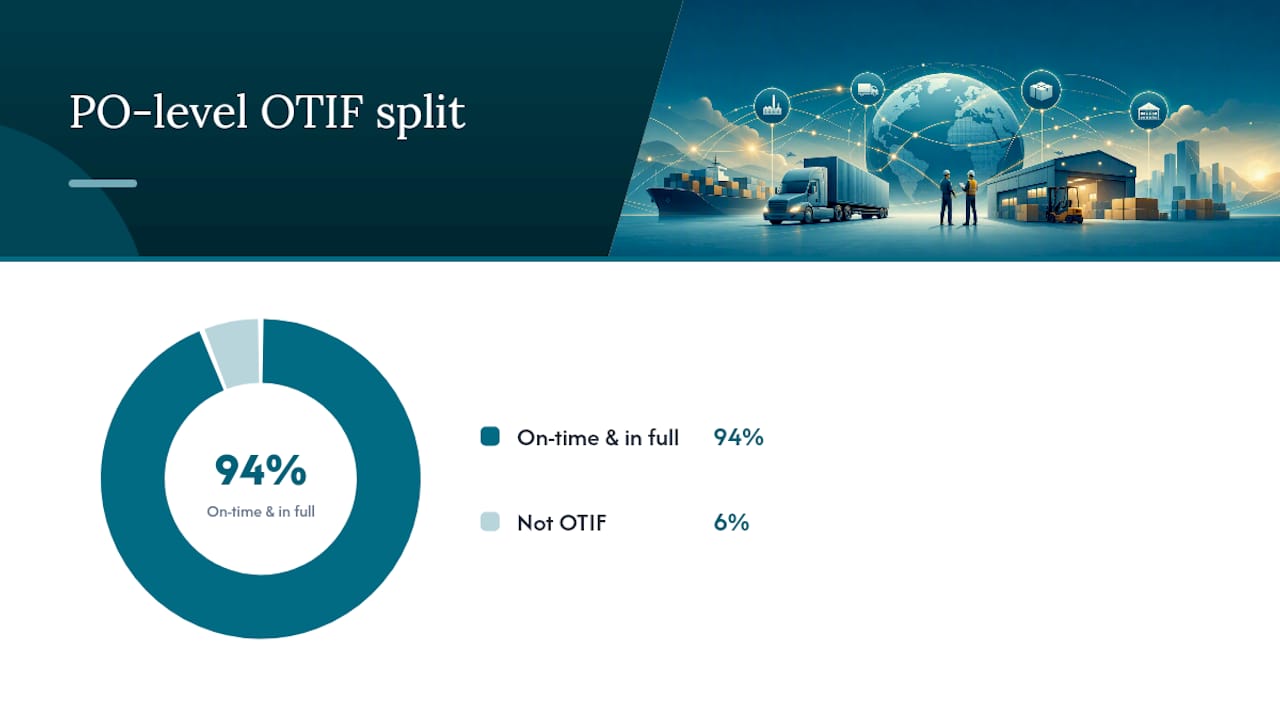
Worked example (PO level): A supplier receives 200 purchase orders in a quarter. 188 arrive on time and in full. OTIF = (188 ÷ 200) × 100 = 94%.
Worked example (SKU level): An order calls for 5,000 units across 3 SKUs; 4,700 arrive correctly matched. Same score, completely different root cause.
What Delivery Benchmarks Should You Target?
Target ranges vary sharply by industry, and treating one blanket number as universal is a common mistake. Automotive supply chains, running tight just-in-time schedules, typically expect 98 to 99% on-time delivery rates, while mechanical engineering sits closer to 95 to 97%, and consumer goods often lands at 92 to 95%.
World-class OTIF sits around 95 to 98%, and some large retail programs enforce a hard 98% floor with financial penalties for suppliers who fall short.
Set alert thresholds tied to trends, not single snapshots. A common governance rule: if OTIF drops below 95% for two consecutive review periods, that triggers a formal corrective action request automatically, no debate needed. One bad month can be weather, a port strike, or a data glitch. Two bad months in a row is a pattern, and patterns are what your scorecard exists to catch.
Where Delivery Data Actually Comes From
Your metrics are only as good as the systems feeding them, and most procurement teams underestimate how much noise creeps in before a single number reaches the dashboard.
Four sources do the real work: your ERP’s purchase order and goods receipt records, supplier advance shipping notices (ASNs), warehouse management system dock confirmations, and carrier tracking data. When these four disagree, which they often do, your OTIF number is only as trustworthy as your reconciliation process.
Common data traps include missing or late ASNs that force manual timestamp entry, consolidated shipments where one truck covers multiple POs and confuses per-order attribution, and timezone mismatches between booking confirmation and physical arrival. A shipment “booked” at 11:50 PM and “received” at 12:10 AM the next day can flip a delivery from on-time to late purely on a clock technicality.
- ERP goods receipt: the system of record for quantity confirmation
- ASN: your early warning signal, useless if suppliers don’t send it consistently
- WMS dock timestamps: ground truth for actual arrival
- Carrier tracking: fills gaps between departure and dock
Build exception rules before you need them. Decide in advance when a late ASN gets adjusted rather than penalized, and log every dispute with a reason code so your quarterly reviews aren’t relitigating the same argument each time. Or-ner’s platform approach ties together ASN integration and shipment tracking specifically to close this reconciliation gap.
Pro Tip: *Run a monthly audit comparing ASN timestamps against WMS receipt timestamps for a random 20-order sample.
Turning Metrics Into a Supplier Scorecard
A single OTIF number tells you a story about one supplier at one moment. A scorecard tells you the story across your whole vendor base, and that’s what actually drives sourcing decisions.
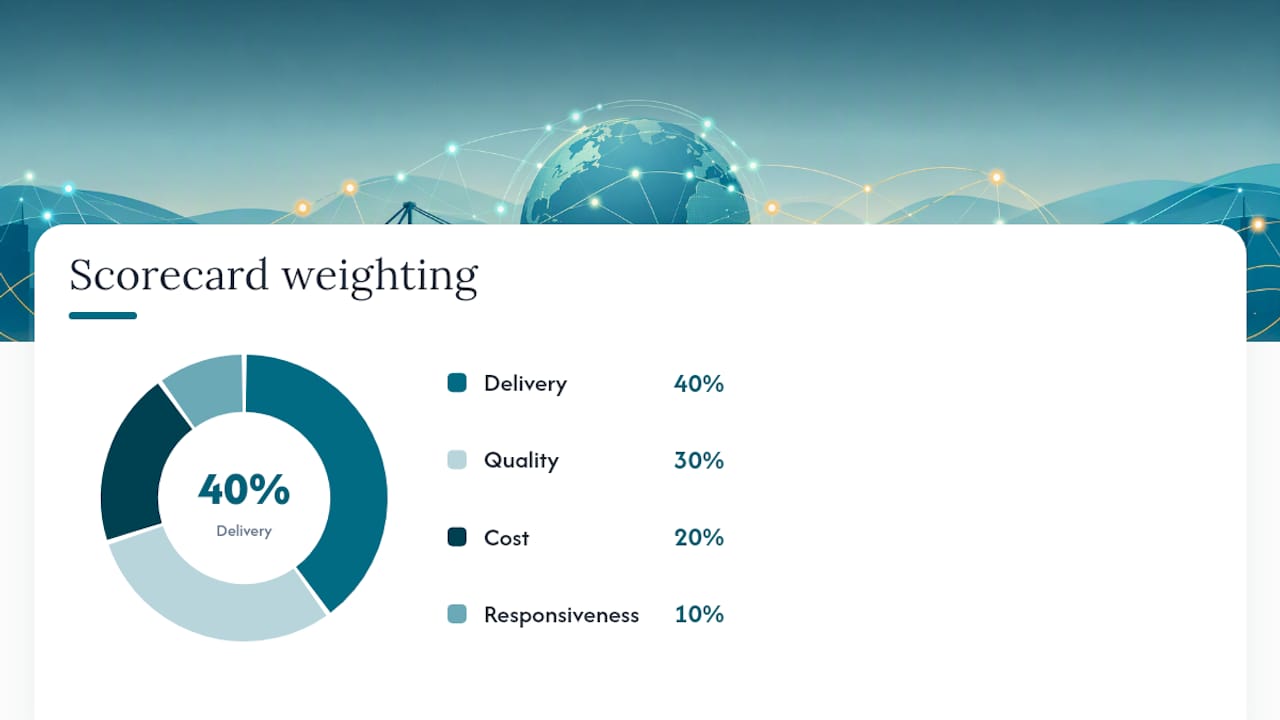
A workable weighting scheme puts delivery at 40%, quality at 30%, cost at 20%, and responsiveness at 10%, a structure many procurement teams use as a starting template. Delivery carries the most weight because a late or short shipment cascades into production delays, missed customer promises, and expedited freight costs that quietly erase any savings the supplier offered on price.
- Normalize scores across a rolling three or six month window to smooth out single-order noise
- Assign green/amber/red bands (for example, above 95% green, 90 to 95% amber, below 90% red)
- Tie amber status to a documented improvement conversation, not just a flag on a dashboard
- Reserve red status for formal corrective action and quarterly business review escalation
- Review scorecards on a fixed cadence, monthly for critical suppliers, quarterly for the long tail
Tune the weighting per supplier category rather than applying one formula everywhere. A single-source component supplier feeding a JIT line deserves a heavier delivery weight than a commodity packaging vendor with three backup sources.
What to Do When Delivery Performance Slips
A scorecard that flags a problem is only useful if it triggers action within days, not at the next scheduled review.
- Stabilize immediately: expedite the current shipment, reschedule production if needed, or activate an alternate carrier to close the gap.
- Diagnose with the supplier: pull the ASN, PO, and goods receipt records together and walk through a root cause analysis rather than accepting a vague explanation.
- Issue a formal Corrective Action Request (CAR) with a defined timeline and measurable target, then track it as its own line item until closed.
- Build a supplier development plan if the root cause is capacity or process, not a one-time event, and set a review date to confirm improvement.
- Reassess sourcing strategy for repeat offenders, phasing in a secondary source rather than betting your production schedule on one vendor’s turnaround promise.
Pro Tip: Separate “will not fix” from “cannot fix” early in the conversation. A supplier lacking the capital for better tracking systems needs a development plan; one that simply hasn’t prioritized your account needs a contract consequence.
How Or-ner Approaches Delivery Measurement in Practice
Instrumenting delivery performance accurately means connecting ASN data, ERP goods receipts, and carrier tracking into one reconciled timeline instead of three disconnected spreadsheets. Or-ner’s platform matches purchase orders against ASNs automatically, flags OTIF exceptions as they happen rather than at month end, and feeds that data into recurring supplier QBRs so procurement teams walk into reviews with evidence, not guesses.
What Most Scorecards Get Wrong
The biggest mistake I see in supplier delivery programs isn’t a missing metric. It’s too many of them. Teams bolt on a dozen KPIs, most overlapping, and end up with a scorecard nobody trusts because it’s noisy and slow to update. Stale ASN data is the second killer: if suppliers aren’t required to send ASNs consistently, your OTIF number is measuring your data pipeline, not their performance. Start narrow. Enforce ASN discipline before you add complexity. A six-point checklist beats a forty-line dashboard every time: track OTIF, OTD, fill rate, lead-time variance, and ASN accuracy; set a tolerance window; define green/amber/red bands; automate the alert; require monthly QBRs for critical suppliers; and log every exception with a reason code. If your current setup can’t produce those six things reliably, that’s the fix to make this quarter, not next year.
— Maayan
How Or-ner Helps You Close the Gap Between Metric and Action
Knowing your OTIF score is 89% doesn’t fix anything on its own. What fixes it is faster visibility into where the shipment is stalling and a way to act before the customer notices. Or-ner is built for exactly that gap: it connects freight booking, real-time tracking, and warehousing into one system so exceptions surface in hours instead of at the next scorecard review.

For businesses running ecommerce or wholesale operations, Or-ner’s platform integrates ASN and shipment tracking directly into your fulfillment workflow, giving procurement teams the reconciled data this article walks through, without manual timestamp chasing. Teams that connect freight booking and warehousing under one operational view typically see fewer disputed exceptions and faster corrective response when a shipment slips. If you’re managing multiple suppliers and want fewer surprises on your OTIF dashboard, look at Or-ner’s reliable courier services and request a walkthrough of how the tracking and warehousing pieces fit your current setup.
Sources
- Key Performance Indicators for Automotive Supply Chain Management (Odette LK03 v2.01)
- How to Measure Supplier Reliability | Buyer24
- Delivery Performance: Definition, Measurement and Optimization in Procurement
FAQ
How do you measure supplier delivery performance?
Measure it primarily through OTIF: the percentage of orders delivered on the agreed date and in the full ordered quantity. Layer in fill rate, lead-time variance, and ASN accuracy for a complete diagnostic view.
How do you evaluate supplier performance overall?
Combine delivery metrics with quality and cost data into a weighted scorecard, commonly delivery at 40%, quality at 30%, cost at 20%, and responsiveness at 10%, reviewed on a rolling window rather than a single snapshot.
What does “supplier performance” actually mean?
Supplier performance is a supplier’s measured reliability across delivery timing, quantity accuracy, product quality, cost competitiveness, and responsiveness to issues, tracked over time rather than judged on any single order.
How do you measure delivery performance specifically?
Delivery performance is typically measured as on-time delivery rate (OTD) or on-time, in-full rate (OTIF), calculated against a firm promised date and quantity within a defined tolerance window.