

TL;DR:
- U.S. retailers are projected to face nearly $850 billion in merchandise returns in 2025, with online returns comprising a significant portion. The true costs of returns extend beyond visible expenses, including inventory depreciation, markdowns, and delayed resales, which often remain overlooked. Effective reduction strategies involve optimizing routing, network design, and policies through cross-functional efforts, backed by data-driven KPIs and organizational alignment.
U.S. retailers are expected to process roughly $849.9 billion in merchandise returns in 2025, with online returns representing approximately 19.3% of all ecommerce sales. For ecommerce managers and logistics professionals, that number is not just a headline. It represents a direct pressure on margins, warehouse throughput, and carrier spend. What makes it worse is that many teams are still guessing at the true cost of each return, tracking only the surface-level numbers while deeper losses accumulate quietly. This guide breaks down exactly where returns logistics costs come from and what you can do to reduce them with precision.
Table of Contents
- Understanding the true costs of returns logistics
- Cost reduction levers: Routing, policies, and network design
- Best practices for implementing cost-efficient returns logistics
- Measuring success: KPIs and analytics for returns logistics cost control
- Why reducing returns logistics costs demands cross-functional thinking
- Optimize your returns and overall logistics with ORNER
- Frequently asked questions
Key Takeaways
| Point | Details |
|---|---|
| Returns costs add up | Even a small percentage of returns can quickly erode ecommerce profitability through hidden costs. |
| Smart routing cuts expenses | Directing returns to the nearest facility can shrink shipping costs by up to 35 percent. |
| Beyond shipping and labor | True returns costs include markdowns, lost resale value, and inventory opportunity costs. |
| Strategic policies save money | Conditional returns and returnless refunds can eliminate unnecessary processing for select items. |
| Continuous tracking is key | Monitoring KPIs and refining processes ensures sustained gains in returns cost efficiency. |
Understanding the true costs of returns logistics
With a clear need to reduce costs, the first step is truly understanding where money goes in your returns process. The visible costs are easy to spot: postage, labels, processing hours. But those are only part of the picture.
Per-return processing costs for standard ecommerce items typically fall in the $10 to $33 range, broken down roughly into reverse shipping ($6 to $15), inspection and restocking labor ($3 to $8), and repackaging materials ($1 to $5). Those figures already sting at volume. A retailer processing 10,000 returns per month at an average of $20 per unit is absorbing $200,000 in direct costs monthly before accounting for anything else.
The deeper problem is what happens next. Many cost-per-return figures omit inventory depreciation, markdown risk, and delayed resale channel losses. A returned item sitting in a warehouse for three weeks may eventually sell, but at a 20 to 40% discount in a secondary channel. That gap between original sale price and resale recovery is real money, and it rarely appears in a logistics team’s cost report.
Here is a breakdown of typical cost layers ecommerce managers should track:
| Cost category | Typical range per return | Often tracked? |
|---|---|---|
| Return shipping | $6 to $15 | Yes |
| Inspection and grading labor | $3 to $8 | Sometimes |
| Repackaging and materials | $1 to $5 | Rarely |
| Markdown / resale channel loss | $5 to $30+ | Rarely |
| Delayed carrying costs | $1 to $4 | Almost never |
| Customer service handling | $1 to $3 | Sometimes |
Complex items such as electronics, fragile goods, or items with batteries require specialized handling, which can push per-return processing costs well above the standard range. A laptop return, for example, may require data wiping, cosmetic inspection, and certified repackaging before it can re-enter inventory. That adds layers of labor cost that generic benchmarks fail to capture.
Reviewing your returns best practices and refining cost tracking is where real financial control starts. Teams that measure total cost including recovered value rate, not just shipping spend, consistently find that their actual per-return burden is 30 to 50% higher than they assumed.
Key hidden cost drivers to monitor:
- Inventory aging from delayed inspection cycles
- Write-offs on items that fail quality checks upon return
- Duplicate customer service contacts caused by slow processing
- Carrier surcharges tied to return shipment weight or zone distribution
- Warehouse congestion from high return volume spikes
Understanding these drivers positions you to evaluate the levers that actually move the needle. Reviewing your reverse logistics strategies with this fuller picture makes strategy prioritization far more accurate.
Cost reduction levers: Routing, policies, and network design
Once you understand the cost makeup, you can evaluate which actions actually deliver savings. There are three major categories: routing optimization, network design, and policy strategy. Each has a different implementation timeline and a different impact profile.
Smart routing is often the fastest win. Reverse logistics routing to the nearest receiving facility is a primary lever for reducing direct shipping costs, with savings commonly cited in the 20 to 35% range. This works because the default behavior for many retailers is to route all returns back to a single central warehouse, regardless of where the customer or the return originates. Restructuring return labels to direct shipments to the closest node in your fulfillment network immediately reduces zone-based carrier charges.
Network design takes longer but yields far greater results. A reverse logistics network redesign can yield substantial modeled cost reductions, with one ecommerce electronics case study reporting average savings of 39.9%. That kind of gain comes from clustering return processing facilities near high-return-volume regions, shortening transportation lanes and consolidating labor. It is a strategic investment but one that pays back quickly at scale.
Policy strategy often gets underused. Returnless refunds, for instance, allow you to refund a customer without requesting the item back. This sounds risky, but for items valued below $15 to $20 where return shipping alone costs $8 to $12, the economics are clear. Customized logistics strategies that incorporate product-level return policies can eliminate entire cost categories for certain SKUs.
Here is a comparison of the primary cost reduction levers:
| Lever | Implementation speed | Savings potential | Complexity |
|---|---|---|---|
| Return routing optimization | Fast (2 to 6 weeks) | 20 to 35% on shipping | Low to medium |
| Returnless refund policies | Fast (1 to 4 weeks) | High for low-value SKUs | Low |
| Network consolidation or redesign | Slow (3 to 12 months) | Up to 40% total | High |
| Carrier contract renegotiation | Medium (1 to 3 months) | 5 to 15% on shipping | Medium |
| Automation of inspection workflows | Medium (2 to 6 months) | 10 to 20% on labor | Medium |
Steps to prioritize your cost reduction program:
- Audit your current per-return cost using the full cost breakdown table above.
- Map your return origin data by zip code or region to identify routing inefficiencies.
- Identify SKU categories where return value is consistently below retrieval cost.
- Evaluate your network node footprint relative to return origin clustering.
- Model returnless refund eligibility criteria for your lowest-margin, high-return products.
Addressing reverse logistics challenges before designing solutions prevents costly missteps. A common mistake is investing heavily in automation before fixing routing, resulting in faster processing of items that never needed to come back in the first place.
Pro Tip: Run a 90-day cohort analysis on returns by SKU and return origin region. You will often find that 15 to 20% of your SKUs are driving 60 to 70% of your return logistics cost. That concentration makes targeted policy or routing changes far more efficient than broad-based process overhauls.
Understanding logistics network design principles helps you model whether a facility expansion, a third-party returns hub, or carrier zone optimization gives you the best return on investment for your specific volume and geography.
Best practices for implementing cost-efficient returns logistics
Having seen the most effective levers, the next challenge is putting them into practice without causing new problems.
The biggest risk in returns cost optimization is a narrow focus. Teams that reduce shipping costs without monitoring what happens to inventory condition often find that faster, cheaper returns actually accelerate write-offs because damaged goods arrive without proper handling. Cutting corners in processing to save labor dollars creates more customer service contacts when items are resold in poor condition.
Actionable implementation guidelines:
- Set return routing rules based on customer ship-from location, not warehouse preference.
- Define returnless refund thresholds by SKU category, not blanket dollar amounts.
- Build a cross-functional returns cost dashboard that finance, operations, and logistics all review monthly.
- Conduct quarterly yield analysis on returned inventory to track actual resale recovery rates.
- Audit repackaging standards to reduce material cost without compromising resale grading.
Returnless refunds and conditional policies reduce reverse logistics transportation and inspection costs for items where retrieval is simply not economically justified. The key is applying those policies surgically, not universally. High-value items still need physical returns for fraud control and inventory accuracy.
“Returns cost control that lives only inside the logistics team is inherently limited. The decisions that drive return rates, such as product descriptions, sizing accuracy, packaging quality, and pricing, are made by people who may never see a returns cost report.”
Knowing how to master returns management means treating it as a whole-business function rather than a warehouse task. When merchandising teams get visibility into return reason codes and cost data, they start adjusting product listings and sizing guides proactively. That is a root-cause fix, not a symptom patch.
Managing returns via courier with reliable courier services is also critical. Inconsistent carrier performance on return shipments creates tracking gaps and processing delays, both of which inflate labor costs and slow inventory recovery. Reliable courier services with full visibility reduce exception handling time significantly.
Pro Tip: Partner your logistics team with your finance team on a quarterly returns profitability review. Finance brings margin context that logistics rarely has. Together they can identify product lines where the total cost of accepting returns exceeds 40% of the product’s sale price, triggering a strategic review of pricing, policy, or product discontinuation. Getting insights from efficient distribution management frameworks can also reveal bottlenecks that cost more than they appear on a logistics report.
A common pitfall is over-automating returns before validating that your routing and policy logic is correct. Automated systems process returns at speed. If the rules are wrong, they also generate errors at speed, and those errors compound quickly across high-volume periods.
Measuring success: KPIs and analytics for returns logistics cost control
To ensure your efforts pay off, build a data-driven feedback loop for returns cost optimization.
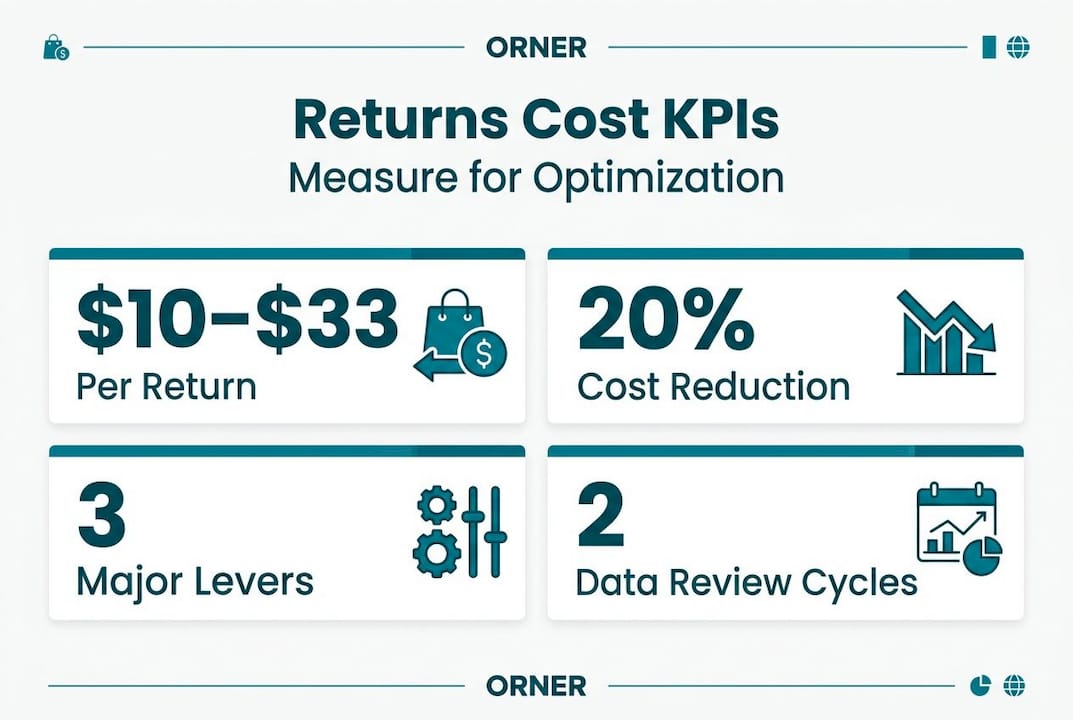
KPIs without context are just numbers. The goal is to track metrics that give you actionable signals, not just retrospective reporting. The standard cost benchmarks of $10 to $33 per return are a useful starting point for benchmarking, but your internal targets should be more granular by category, channel, and return reason.
Core KPIs for returns logistics cost control:
| KPI | What it measures | Target signal |
|---|---|---|
| Cost per return (total) | Full processing burden per unit | Trending down over time |
| Return shipping cost per unit | Carrier and routing efficiency | Below benchmark for your zones |
| Processing time (receipt to resale-ready) | Throughput and labor efficiency | Under 5 business days for standard items |
| Recovered value rate | Resale revenue vs. original sell price | Above 60% for most categories |
| Return rate by SKU | Product-level return frequency | Flagging outliers for root cause review |
| Returnless refund utilization | Policy application rate | Matched to eligibility criteria |
A structured review cycle helps you stay ahead of cost creep:
- Pull weekly return volume and cost data by SKU and return reason.
- Review recovered value rates monthly by product category and channel.
- Conduct a full cost-per-return audit quarterly, including hidden costs.
- Compare current benchmarks against industry norms and internal targets every six months.
- Adjust routing rules, policy thresholds, and network footprint based on trend data annually.
Building this loop into your supply chain strategies creates compounding gains over time. Teams that review return data consistently catch cost increases early, before they become embedded in their baseline. The ones that review annually often find they have absorbed months of margin erosion before taking action.
Analytics should also feed forward into product and sourcing decisions. If a specific supplier’s items consistently generate returns due to quality issues, that cost belongs in the supplier performance review, not just the logistics report.
Why reducing returns logistics costs demands cross-functional thinking
Here is something most articles about returns logistics cost control miss entirely. The framing is almost always tactical. Route better. Automate more. Renegotiate carrier contracts. Those actions matter, but they address symptoms rather than causes.
In our experience working with ecommerce operations at scale, the businesses that make the most durable reductions in returns costs are the ones that treat returns as a cross-functional problem. Logistics teams can optimize what comes through the door. They cannot control how often the door opens.
The volume and character of returns are determined by decisions made long before a customer initiates a return. Product descriptions that set inaccurate expectations drive “not as described” returns. Poor sizing consistency in apparel drives fit-related returns. Fragile products shipped in insufficient packaging drive damage returns. None of those are logistics failures. All of them land in the logistics cost center.
Understanding the full reverse logistics process from the customer trigger all the way through resale requires visibility across the business that most logistics teams simply do not have access to by default.
The teams we see outperform consistently share one structural trait. They have a returns cost owner who sits outside logistics, usually in finance or operations leadership, who bridges data between departments. That person ensures that return reason code data reaches the product team, that resale recovery rates inform pricing strategy, and that returnless refund policies are evaluated against customer lifetime value models, not just per-transaction economics.
This matters especially during peak seasons when return volume spikes sharply. Without cross-functional coordination, logistics teams absorb the cost surge without the organizational visibility to address root causes in the following planning cycle.
The uncomfortable truth is that a logistics-only approach to returns cost control will always hit a ceiling. The next level of savings sits upstream in product quality, content accuracy, and packaging design, and reaching it requires organizational alignment that goes well beyond warehouse efficiency.
Optimize your returns and overall logistics with ORNER
For ecommerce managers ready to move from analysis to action, having the right infrastructure makes all the difference in how quickly savings materialize.
ORNER’s logistics platform is built specifically for ecommerce operations that need reliable, scalable support across the full supply chain. From streamlined ecommerce freight booking that reduces carrier costs on both outbound and return shipments, to a global warehouse network optimized for fast inventory recovery, ORNER gives logistics and ecommerce teams the tools to implement the routing, network, and policy strategies covered in this guide. Explore warehousing best practices designed for ecommerce operations, and see how the platform’s real-time tracking and analytics capabilities support the KPI-driven optimization cycle that turns returns from a cost center into a manageable, measurable process.
Frequently asked questions
What is the average cost to process an ecommerce return?
Standard ecommerce returns typically cost $10 to $33 per item, covering return shipping, inspection labor, and repackaging materials, with complex items often exceeding that range.
Which part of returns logistics costs the most?
Return shipping generally accounts for the largest single share, with shipping and labor costs combined often representing 60 to 70% of total per-return processing expense.
How can we reduce returns shipping costs?
Routing returns to the nearest receiving facility rather than a central warehouse can cut return shipping costs by 20 to 35% by reducing zone-based carrier charges.
Are returnless refunds always cost-effective?
Returnless refunds work best for low-value items where the retrieval and processing cost outweighs the resale recovery, making them a smart policy tool rather than a blanket approach.
Why do some cost calculations understate total returns logistics impact?
Many analyses only track direct shipping and labor, omitting inventory markdowns, delayed resale losses, and channel downgrade costs that can add $5 to $30 or more per unit to the real total.